
F-2 AIPS
Formosat-2 Automatic Image Processing System (F-2 AIPS)
Formosat-2 imagery is available for 2m in panchromatic (PAN) (0.45~0.90 mm) and 8m in multispectral (MS) from visible to near-infrared (0.45~0.52, 0.52~0.60, 0.63~0.69, 0.76~0.90 mm) with swath of 24 km. The spectral and spatial information of the Formosat-2 sensor can be referred to (Table 1 in Liu, Wu, et al. 2009). Equipped with three sets of two-axes high torque reaction wheels, Formosat-2 is able to point not only to ±450 across track, but also to ±450 along track (Liu et al. 2007). Together with the exactly repeating orbit with daily revisit interval, Formosat-2 imagery is ideal for continuous monitoring of natural disasters. To meet the operational requirement of an IADC, the F2 AIPS is developed and implemented to fully exploit the advantages of daily revisit imagery in site surveillance and, an automatic Formosat-2 image processing system (F2 AIPS) has been developed and implemented at Global Environment Monitoring and Response Center (GEMARC). This system is comprised of eight modules that are able to digest the raw data based on Gerald (GEneric RAw Level Data) format, apply the basic radiometric and geometric correction, output the level-1A product, conduct the rigorous band-to-band coregistration (Liu et al. 2007), automatic orthorectification (Liu and Chen 2009), multi-temporal image geometrical registration (Liu, Chang, et al. 2009), multi-temporal image radiometric normalization (Liu, Shieh, et al. 2009; Chang et al. 2009), Spectral Summation Intensity Modulation pan-sharpening (Liu et al. 2007), the absolute radiometric calibration (Liu, Kamei, et al. 2010), as well as the superoverlay output for displaying on Google Earth platform (Liu 2010; Liu and Chang 2009). These modules are describes as follows.
1 Gerald raw data digestion and basic geometric and radiometric correction
The Formosat-2 satellite provides compressed, packetized and coded image telemetry through X band. This telemetry is received by a dedicated ground station to reconstitute the Gerald format data by the processes of decompressing, depacketizing, and decoding. As the pixels do not behaves identically in terms of response and offset, we have to apply the radiometric calibration data to each pixel and convert the output numerical unit (8 bits scale) to the standard radiance unit. The basic parameters of RSI geometrical structure are also employed at this stage to calculate the four-corner coordinates of Gerald data, which can be projected to the ground for image indexing and searching. Note that the problem of band-to-band mis-registration is also fixed at this stage by applying the polynomial coefficients of CCD pointing direction (Line of Sight) for each band derived from the measurement and image data, and the bias between RSI frame and body frame. All these processes, namely Level-1A processing, have been implemented in F2 AIPS to generate the Level-1A product from Gerald data. Figure 1 gives one example of projecting Level-1A image to Google Earth for image indexing and searching.
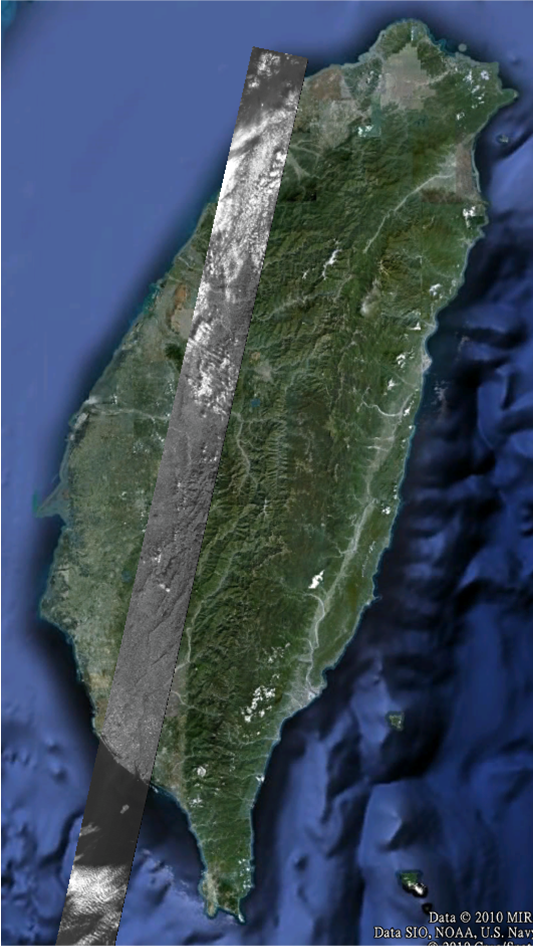
Gerald imagery on Google Earth Platform
2 Band-to-band coregistration
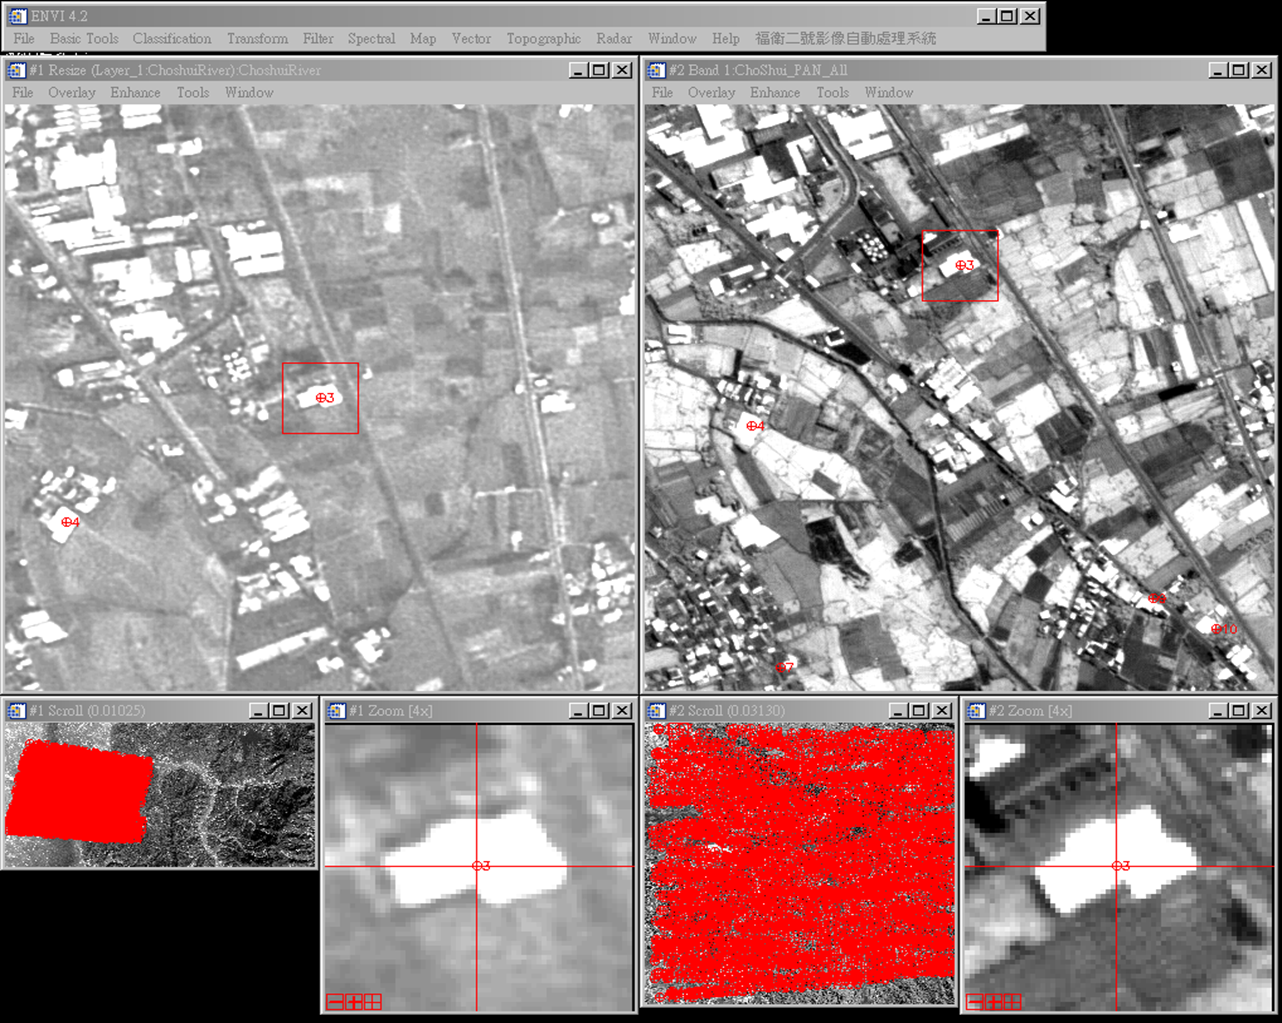
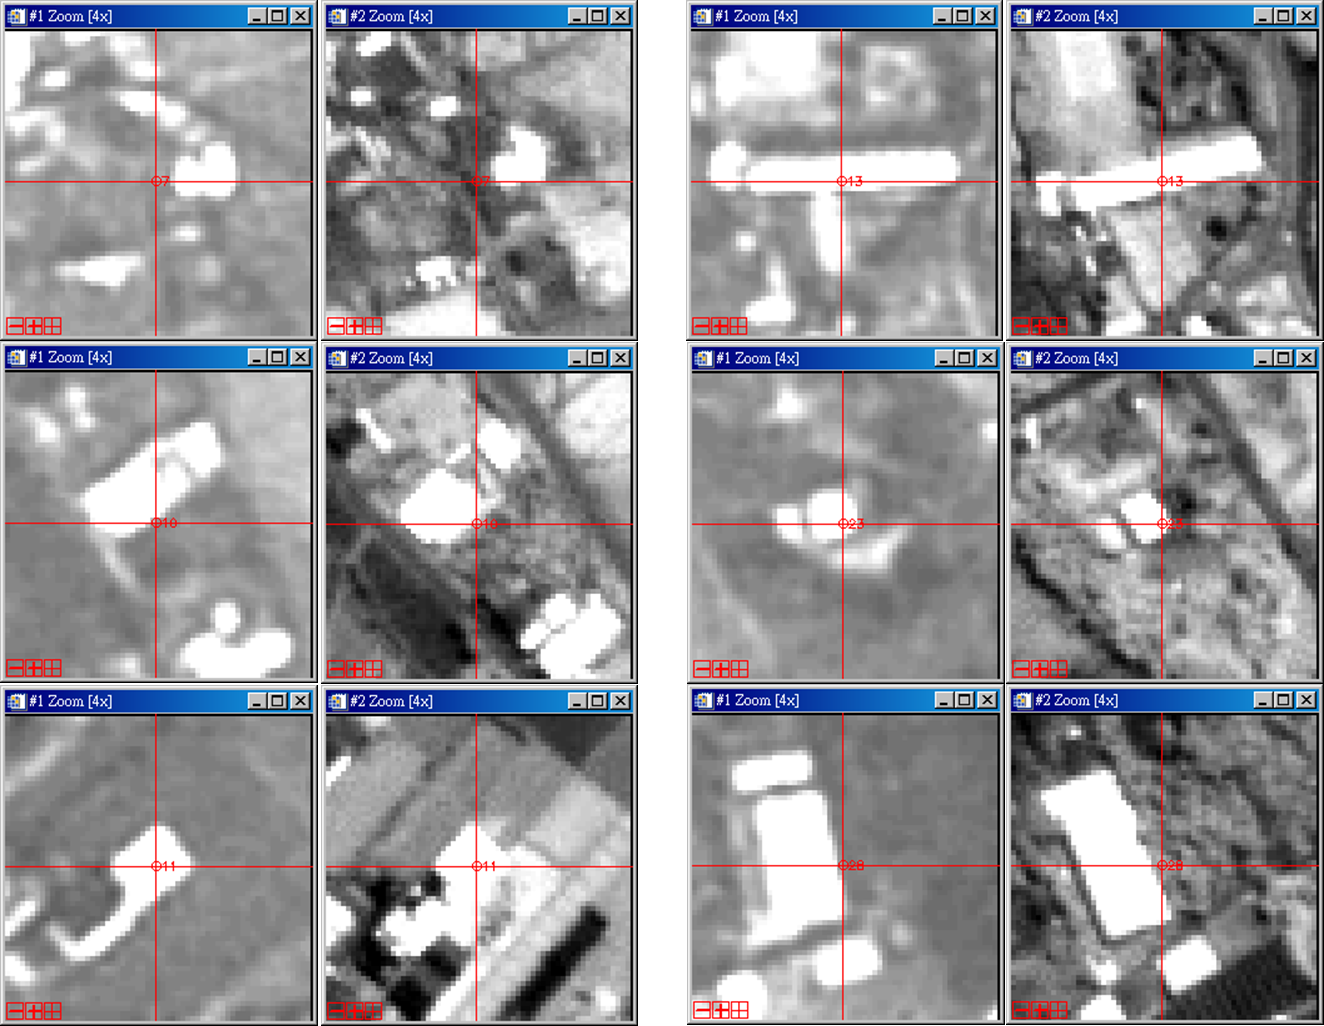
F-2 AIPS uses the PAN image as the base. The size of the subscene for comparison can be selected to as high as 51x51 pixels to cover enough spatial features and hence improve the correlation. The size of the searching window can be set to several times the size of the subscene to ensure that the mis-registration between PAN and MS caused by the relief displacement can be found. Considering the balance of energy to simulate a PAN image, the technique of fast normalize cross coefficient (FNCC) can be employed to rapidly generate a large amount of co-registered image pairs with large cross correlation coefficients. Since the distribution of these co-registered image pairs is so dense and most of them bear a pretty high value of correlation, we may reasonably assume that the displacement for each subscene is close to the displacement interpolated from its neighbor subscenes and the error-prone co-registered image pairs can be completely ruled out. An accurate PAN-to-MS band-to-band co-registration can be achieved by using the third-order polynomial transformation derived from the retained co-registered image pairs. Detailed description of this module can be referred to (Liu 2006).

Example of the misregistration between the Formosat-2 pan (a) and MS (b) bands in one standard scene (12x12 km). The red-cross symbol points to the center of each subscene (51x51 pixels) on the pan image, wile the blue-cross symbol indicates the central position of the corresponding subscene on the MS imager. Five regions denoted by the green boxes are further enlarged in (c)–(g) for illustration. This pair of image was taken on 1 December 2005 in the catchment area of the Shihmen Reservoir located in the northern part of Taiwan. (reprint from Liu 2006 IEEE TGRS)
3 Automatic orthorectification
With a certain amount of ground control points (GCPs), a digital elevation model (DEM) of the imaging area, and a detailed attitude of the sensor, a rigorous orthorectification can be made to generate the rigorous-orthoimage from the raw images taken from the satellite (Liu 2006). However, the process of manual selection and matching of the GCPs is time-consuming and error-prone. To meet the requirements of environmental monitoring and disaster assessment, the automatic orthorectification module in F2 AIPS is able to (1) select a large amount of GCRs from the aerial orthoimages, (2) match the ground control regions (GCRs) on the aerial orthoimage and the Formosat-2 level-1A image, (3) filter out the problematic GCRs, and (4) establish a transformation model to conduct a rigorous orthorectification of Formosat-2 imagery. Detailed description of this module can be referred to Liu and Chen (2009).

4 Multitemporal imagery geometrical registration
Accurate spatial registration between multitemporal imagery is necessary if pixel-level changes are to be detected (Coulter, Stow, and Baer 2003). Even with the rigorous orthorectification of multitemporal Formosat-2 imagery, the change artifacts are significant and visually obvious if change detection is performed directly with this type of imagery (Dai and Khorram 1998). Since the daily-revisit orbit enables Formosat-2 to observe the same place from the same viewing angle under the similar illumination conditions, the inconsistency in geometric shapes of the same object and its shadows among various images can be avoided by keeping the same viewing angles and the similar illumination conditions. The multi-temporal imagery obtained from Formosat-2, therefore, can be automatically matched and compared with each other to a high extent of accuracy (Liu 2006).Examples of multi-temporal imagery geometrical registration and detailed description of this module can be referred to (Liu 2006; Liu et al. 2009d).

Example of site surveillance at Kaohsiung International Airport using daily revisit imagery taken by Formosat-2 on (a) 2 July 2005, (b) 3 July 2005, and (c) 4 July 2005, respectively. The color composite of red (pan band of July 2), green (pan band of July 3) and blue (pan band of July 4) is shown in (d). (Reprint from Liu 2006 IEEE TGRS)
5 Multitemporal imagery radiance normalization
Another prerequisite for pixel-level change detection is the radiance normalization among multitemporal imagery (Du, Teillet, and Cihlar 2002). Schroeder et al. (2006) compared six atmospheric correction methods (Canty, Nielsen, and Schmidt 2004 Nielsen, Conradsen, and Simpson 1998; Du, Teillet, and Cihlar 2002) and demonstrated that absolute correction methods actually make images in a time-series somewhat less spectrally similar to one another, while the relative correction methods produce the most consistent temporal reflectance response. F2 AIPS employs the approach proposed by Du et al. (2002) and applies a principle component analysis with some quality control criteria to determine the pseudo invariant features (PIFs) on the multitemporal images automatically. Based on these PIFs, the linear relationships can be established to normalize the radiances among the multitemporal images of the same area (Liu, Shieh, et al. 2009). Examples of multi-temporal imagery radiance normalization and detailed description of this module can be referred to (Liu et al. 2009).

6 Spectral summation intensity modulation pan-sharpening
A lower spatial resolution multi-spectral image can be integrated with a higher spatial resolution panchromatic image by various pan-sharpening techniques (Lillesand, Kiefer, and Chipman 2004). The general approaches, such as the HSI transform (Haydan et al. 1982) and Brovey transform (Gillespie, Kahle, and Walker 1987), however, cannot avoid distorting the image’s spectral properties. Since the spectral range of PAN band covers the whole range of the four MS bands, Formosat-2/RSI satisfies the condition that the summation of all MS bands is a low resolution replica of the high resolution PAN image, with only a small gap between MS band 3 and 4. We follow the concept of smoothing filter-based intensity modulation method (Liu 2000) and propose an improved approach for spectral preserve image fusion, namely spectral summation intensity modulation (SSIM). Examples of SSIM pan-sharpening imagery and detailed description of this module can be referred to (Liu et al. 2007).

7 Edge Sharpening and Adaptive Enhancement
Satellite imagery are often influenced by the weather so some image detailes might be too obscure to be distinguished. However, this problem cannot be solved by linear enhancement or histogram equalization. As disaster occurs, it demands to rapidly detect specific regions that are severely damaged from a broader area. This system uses adaptive enhancement to enhance each detail of the whole image. And edge sharpening also help to sharpe edges of each object which makes it easier for disaster detection and variation analysis.

8 Absolute radiometric calibration
An electro-optical sensor is simply a device that converts an optical input into an electrical signal. The sensitivity of such sensors degrades over time. In order to compensate for this, radiometric calibration needs to be undertaken on a regular basis. Although an accurate calibration can be easily accomplished in a well-controlled laboratory, the real challenge is the in-orbit calibration. These in-orbit calibrations can be categorized as one of three major methods: onboard (Kerola et al. 2009), vicarious (Thome et al. 2008) and cross calibrations. However, considering the difficulties in predicting the decay of the standard lamp onboard, more and more sensors rely on vicarious and cross calibrations. We collaborate with ASTER calibration team to collect the ground data at Ivanpah Playa and Railroad Valley in Nevada dessert during the regular field campaigns in the summers of 2006 and 2008. Various instruments, including ozonometer (Microtops II, Solar Light Co.), skyradiometer (POM-02, Prede Co., Ltd.), portable spectroradiometer (FieldSpec 3, Analytical Spectral Devices Inc.) were used to measure the atmosphere composition and ground reflectance simultaneously with the overpass of Formosat-2 at 10:23-10:24 local time. Detailed description of this work can be referred to (Liu et al. 2010).
